

DNREC Menu
Delaware contains approximately 1.25 million land acres, of which approximately 359,000 are forested. The definition of forest used to determine forest acreage includes traditional, non-urban areas with forest cover.
Delaware, once mostly forested, has lost over half of its forests since the time of European settlement. Historically, losses stemmed from conversion to agriculture, but now they are mostly the result of residential and commercial development and associated infrastructure. Forest loss stabilized around 1900, and Delaware’s forestlands have increased in the early 20th century, but these recovered forestlands lack the species diversity that once existed prior to European settlement. Today, residential and commercial development has resulted in a loss of forestland and forest acreage.
| Year | Acres (x 1,000) |
|---|---|
| 1907 | 350 |
| 1920 | 351 |
| 1938 | 423 |
| 1953 | 454 |
| 1963 | 392 |
| 1977 | 392 |
| 1986 | 389 |
| 1999 | 382 |
| 2008 | 352 |
| 2012 | 348 |
| 2016 | 355 |
| 2018 | 359 |
In total, one-third of Delaware’s forests, are protected from development. These lands include government-owned and NGO tracts, as well as areas protected by permanent conservation easements, including over 36,000 acres of forestland protected through easements purchased by the Delaware Aglands and Forestland Preservation Program (Delaware Forest Service 2020).
The Great Cypress Swamp, a large, forested wetland complex spanning the border of Sussex County, Delaware and Worcester County Maryland once covered nearly 50,000 acres with forests dominated by Atlantic white cedar and bald cypress. Since the early 1800s, however, logging, ditching, draining, drought, and fire have reduced the swamp to a quarter of its pre-colonial size, and have resulted in major shifts in the dominant vegetation comprising the forests. Despite drastic changes in the swamp over the last 200 years, it is currently one of the largest contiguous tracts of forest remaining on the Delmarva Peninsula (Bennett et al. 1999).
Delaware Forest Service manages three state forests totaling over 20,000 acres: Blackbird State Forest (6,000 acres) near Smyrna, Taber State Forest (1,309 acres) near Harrington, and Redden State Forest (over 14,000 acres) near Georgetown.
Delaware’s forested habitats are highly fragmented. Mapping of tree cover in the state completed in 2004 by DNREC’s Division of Parks and Recreation delineated about 4,150 separate wooded patches larger than 10 acres (DNREC unpublished data). The median size among those patches is only 34 acres, and just 6% are larger than 250 acres. An examination of patch “thickness,” which accounts for size and shape, revealed that only a few (<0.1%) patches had sufficient interior habitat to sustain area-sensitive forest species. Additional analysis indicates that the patches are highly isolated from each other, with less than 10% meeting the isolation thresholds for hooded warbler, American redstart, red-shouldered hawk, and brown creeper. Finally, calculation of perimeter/area ratio for the forest blocks highlights their very irregular shapes. Almost 90% have a ratio greater than that of a 10:1 rectangle, a configuration that produces major edge effects.
Field surveys of nearly 100 Coastal Plain forest blocks found about half of them to be in “Good” or “Very Good” condition, but this rating was based on vegetative characteristics, not on spatial attributes or wildlife habitat (McAvoy et al. 2006).
In Delaware and throughout the region fire suppression has led to “mesophication” of forest, a shift from fire-adapted, shade-intolerant species to fire-sensitive, shade-tolerant species (Nowacki and Abrams 2008).
In addition, the gypsy moth, which was first detected in Delaware in 1979, severely impacted oak forests throughout the state. Many of these forests now lack sufficient canopy tree regeneration potential or have experienced mesophication because of changes in species composition from oak to maple and gum (Delaware Forest Service 2020).
Fire suppression, mesophication, invasive plant species, and overbrowsing by White-tailed Deer have severely reduced the ability of northeastern forests to regenerate.
More information about Delaware’s Forests can be found in the Delaware Forest Resource Assessment and the Statewide Forest Strategy, produced by the Delaware Department of Agriculture’s Delaware Forest Service, and updated and submitted to the U.S. Forest Service every ten years.
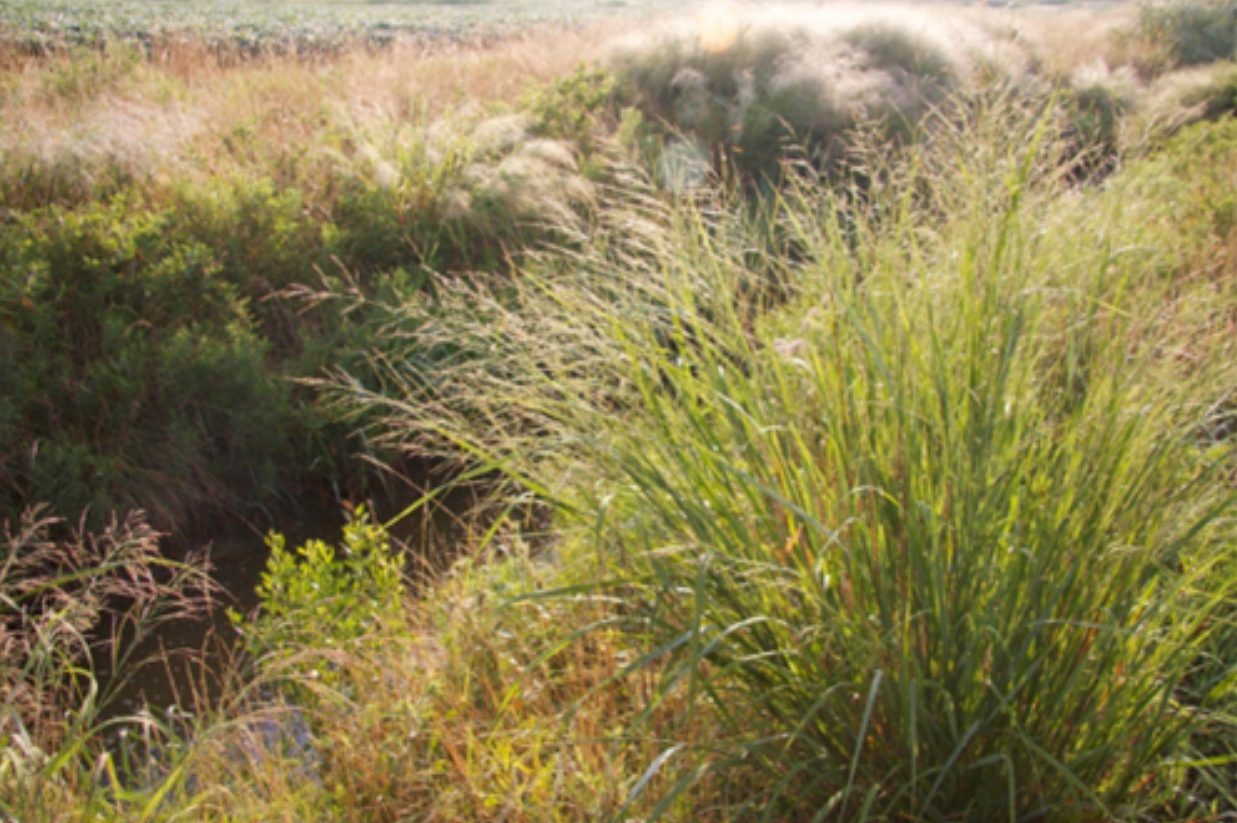
These coastal upland habitats are adapted to the dynamic conditions of shifting sands, strong winds, and salt spray unique to the narrow zone along the Atlantic Ocean and Delaware Bay. They range from sandy beach above the high-tide line to the grassy dunes and overwashes, to a complex of shrub-dominated back dunes. Intertidal beach areas are covered under the Tidal Wetlands section, while groundwater-controlled interdunal wetlands or swales are included in Non-tidal Wetlands.
These habitats have declined significantly in extent and quality since historical times, primarily because of residential development and associated infrastructure, particularly artificial shoreline hardening and jetties and groins. In recent decades, this decline has greatly slowed on the Atlantic Coast, where most remaining habitats are on public land. Losses continue, albeit more slowly, along the shorelines of the Delaware Bay and Inland Bays. All these habitats are subjected to on-going impacts from recreational activities, and Delaware Bay beaches in particular are occasionally impacted by oil spills. The long-term prospect for beaches and dunes is potentially poor given predicted sea level rise, even though these disturbance-dependent habitats might be expected to accommodate sea level rise reasonably well by migrating inland. However, onshore and offshore coastal processes that would facilitate such a shift, especially sand transport, may have already been irreversibly compromised by the issues noted above. Efforts to stabilize dunes may also further disrupt these processes in the future, despite their seeming benefits at present. Beach replenishment is a potential solution to the loss of natural sand transport, but costs are very high and nearshore habitats that serve as a sand source, as well as intertidal habitats upon which sand is placed, may be adversely impacted.
Delaware has a rich history of agriculture, and this land use has heavily shaped the distribution, structure, and quality of habitats in the state. Thirty-nine percent of all land in Delaware is part of a farm (Kee n.d.). As in other states, many forests and early successional habitats were previously farmed, wetlands ditched, and marshes managed for salt hay. Today’s agricultural landscape in Delaware is dominated by row crops. The upland areas of the Coastal Plain host the most intensive row crop agriculture on the Delmarva Peninsula, including primarily corn and soybeans. In addition, poultry farms are widespread and are highly economically important. Vegetable production accounts for fewer acres, but is nearly as valuable as corn and soybeans in terms of annual commodity marketing receipts (Kee n.d.). Statewide, land in farms decreased from 589,107 acres in 1997 to 520,000 acres in 2024. Total cropland as of 2025 was 414,800 acres, with a total of 403,700 acres harvested.
Loss of habitat heterogeneity is a major factor driving observed declines in farmland biodiversity around the world, and farms with greater on-farm heterogeneity support higher levels of biodiversity (Belfrage et al. 2015). Throughout the country, the removal of fencerows and enlargement of fields that has accompanied agricultural intensification during the second half of the 20th century has led to decreased structural heterogeneity on working farms (Best 1983, Basore et al 1986).
Opportunities for conservation on working lands are provided by several USDA Natural Resources Conservation Service (NRCS) programs, including the Conservation Reserve Program (CRP), Wetlands Reserve Program (WRP), Farmable Wetlands Program (FWP), and Conservation Reserve Enhancement Program (CREP). CRP is a program established by the USDA in 1985 that takes land prone to erosion out of production for 10 to 15 years and devotes it to conservation uses. In return, farmers receive an annual rental payment for carrying out approved conservation practices on the conservation acreage. The WRP, FWP, and CREP programs are included under the Conservation Reserve Program and offer landowners financial incentives for conservation practices such as filter strips. Acres in these programs declined from 9,221 in 2007 to 7,808 in 2012, and only 2,837 in 2025 (USDA 2025).
Wetlands are perhaps Delaware’s most significant natural feature, covering one-fourth of the state, with a total of approximately 296,000 acres. An estimated 48 percent of wetlands are in Sussex County, 37 percent in Kent County, and 15 percent in New Castle County. Wetland habitats include a wide range of types – tidal, nontidal, freshwater, brackish, and saltwater, and include coastal wetland impoundments, vernal pools, Coastal Plain seasonal pond wetlands, peat wetlands, and Piedmont stream valley wetlands. Wetlands are found along the shores of the Delaware Bay and Inland Bays, along rivers, streams, and ponds, and in forests and fields throughout the state.
Delaware has lost more than 50% of its wetlands since the 1700s. The majority of these were freshwater wetlands that were lost to ditching, stream channelization, conversion to ponds, and filling for development. Tidal wetlands were also lost to filling for development, shoreline hardening, conversion to impoundments, and ditching for mosquito control or agricultural drainage. Fortunately, wetland regulations at both the state and federal levels have greatly curtailed these losses in the last several decades. Tidal wetland losses have slowed dramatically, but protection of isolated freshwater wetlands remains insufficient.
Delaware completed a Statewide Wetlands Mapping Project in 2017 in partnership with National Wetlands Inventory (NWI). This effort updated previous state wetland maps from 2007 and produced a Delaware Wetlands: Status and Trends from 2007-2017 (DNREC 2022). The 2017 effort mapped 296,351 acres of wetlands across the state of Delaware.
Palustrine forested wetlands make up 50% of the state’s wetlands. Estuarine emergent wetlands comprise 24 percent of the wetlands statewide. Forty-seven percent of Delaware’s wetlands are in Sussex County, 38% in Kent and 15% in New Castle County. Forty-four percent of Delaware’s wetlands fall within the Delaware Bay Basin, 34% in the Chesapeake Basin, 20% in the Inland Bays Basin, and 2% in the Piedmont Basin (DNREC 2022).
Many wetlands in the state suffer from degradation caused by sedimentation, nutrient enrichment, and invasive plant species. These problems are exacerbated by insufficient natural buffers around many wetland blocks. Tidal wetlands, which constitute the great bulk of wetland blocks, are almost all threatened by sea level rise, especially given the lack of buffers to accommodate migration.
The Delaware Ecological Network (DEN) identified intact and ecologically important “core” wetlands in Delaware. Core wetlands comprised 53% of total wetland area in the state. Assuming a 10 m positional error, 760 of 880 (86%) wetland-dependent rare species or community Element Occurrences fell within core wetlands (Weber 2013).
The DNREC Wetland Monitoring and Assessment program is tasked with the job of assessing the health of Delaware’s Wetlands. To complete this task, each season a field crew assesses the health of wetlands on a watershed level. For each watershed, a wetland assessment report is developed, and a relative health score is determined. For more information, visit the Wetland Health Assessment page: https://dnrec.delaware.gov/watershed-stewardship/wetlands/assessments/.
The 2021-2025 Delaware Wetland Program Plan (DNREC 2020) was produced by DNREC’s Wetland Monitoring and Assessment Program, updating the 2015 version and identifying four main objectives to increase wetland acreage and improve wetland conditions in Delaware. The Plan highlights accomplishments towards those objectives over the prior five years, such as progress on Monitoring and Assessment, Voluntary Restoration and Protection, and education and collaboration, but indicating that the fourth objective, Regulation, needs more work.
Delaware’s non-tidal wetlands are critically important to SGCN. The following wetland habitats are natural or semi-natural non-tidal wetlands.
Non-tidal freshwater wetlands are the most abundant wetland type by acreage in Delaware, at just over 166,597 acres mapped (DNREC 2022). These wetlands support a large percentage of the biological diversity and rare species found in Delaware. Though sea level rise is not as great a threat to non-tidal wetlands as tidal wetlands, loss of these habitats has already occurred, and is one of the causes of the loss of 2,773 acres of nontidal wetland between 2007 and 2017. Conversion of non-tidal wetlands to tidal, and further wetland loss, is predicted to continue as sea level rises.
A variety of human-modified wetland habitats occur in Delaware. While these habitats may not serve the same ecological functions as natural wetlands, they are nevertheless important to various SGCN. Because these modified lentic water bodies serve as “catch basins” for pollutants, nutrients, and sediments from the surrounding area, they are especially susceptible to water quality impairment. DNREC has found that 74% of Delaware’s freshwater ponds and lakes do not fully support the fish and wildlife designated use as defined by water quality criteria (DNREC 2013).
With over 113,000 acres of tidal estuarine wetlands and over 10,000 acres of tidal palustrine wetlands, Delaware’s tidal wetlands in total account for nearly half of the state’s wetlands (DNREC 2022). Tidal marshes are widely recognized for their ecological importance, as well as their importance to human populations. Tidal marshes filter contaminants and nutrients, improve water quality, sequester carbon, and protect coastal communities from flooding (Kreeger et al. 2010). A wide range of terrestrial and aquatic species, including birds and commercial and recreational fish and crustacean species, use tidal marsh habitats for nursery grounds and other functions during their life cycles.
The Delaware River is fringed by a contiguous band of brackish/saltwater tidal marshes from the mouth of Delaware Bay upstream to the Delaware Memorial Bridge. Beyond the tidal marsh fringe, tidal wetlands are predominately tributary-associated freshwater tidal wetlands that occur in discrete patches.
Salinities in polyhaline salt marshes near the mouth of the Delaware Bay range from 18 to 30 parts per thousand (ppt) and are dominated by two grass species, Smooth Cordgrass (Spartina alterniflora) and Saltmeadow Cordgrass (Spartina patens). Brackish (mesohaline) marshes, with higher vascular plant diversity than salt marshes, occur upstream of the bay mouth in salinity ranges from 5 to 18 ppt (Odum 1988). Oligohaline marshes with salinities less than 5 ppt support the highest species diversity and are at most risk from sea level rise. These habitats provide a critical buffer between the tidal ocean and bay aquatic environments and the upland habitats of the Delaware Estuary.
It has been estimated that the Delaware Estuary has lost more than half of its wetlands, and more than 95% of freshwater tidal wetlands, since early settlers arrived (PDE 2008). Historical losses occurred primarily because of development and conversion of wetlands for agriculture and other purposes. Despite increased regulatory oversight and “no net loss” policies that have greatly slowed rates of wetland conversion, we continue to lose all types of wetlands within the Delaware River Basin (PDE 2012).
Although seldom destroyed outright, these habitats have been somewhat impacted by ditching, dredging, and channelization. They also have long been subject to incremental degradation arising from incompatible land use practices upslope, often magnified by the frequent loss of adjacent buffers. Opportunities for migration inland of this habitat in the face of sea level rise will be limited by topographic features and mill pond dams on tidal coastal plain streams. Purely fresh (0 ppt) tidal marshes in Delaware are now only found on the Christina and Nanticoke Rivers (W. McAvoy personal communication). It is estimated that between 84% and 98% of freshwater tidal wetlands will be impacted by sea level rise by 2100 (Love et al. 2012).
Estuarine wetlands are systems associated with coastal salt or brackish waters. These areas extend upstream into coastal rivers to the point where salinity levels decline to negligible levels (less than 0.5 ppt).
Eighty-one percent of Delaware’s estuarine wetlands occur on fringe landforms, with unobstructed connection to tidal embayments. Islands of wetland surrounded by open water account for 12%, while 7% of estuarine wetlands in Delaware are cut off from full tidal flow by roads, dikes, or similar structures and are thus considered basin landform types. These were discussed above under impoundments.
The predominant estuarine habitat in Delaware is salt marsh. Delaware has high regional responsibility for salt marsh habitat, with 9% of the salt marsh in the Northeast region (Anderson et al. 2013a), relative to only about 1% of the land area.
Salt marshes are universally considered to be among the most important wildlife habitats in North America, and Delaware’s contribution to the regional distribution and conservation of this habitat is significant.
The Delaware River is the longest un-dammed river in the United States east of the Mississippi, extending 330 miles from the confluence of its East and West branches at Hancock, N.Y. to the mouth of the Delaware Bay where it meets the Atlantic Ocean. The river is fed by 216 tributaries, the largest being the Schuylkill and Lehigh Rivers in Pennsylvania. The tidal reach extends from where the river enters Delaware Bay near Wilmington, Delaware upstream to near Trenton, NJ. The salt line, where brackish waters meet fresh waters, usually ranges across approximately the lower third of this reach (DRBC 2008). As of May 27, 2025, the salt line was located 65.9 river miles upstream from the mouth of the Delaware Bay, seven miles upstream of the Delaware Memorial Bridge (DRBC 2025)
It is important to note that sea level rise may inundate many of the Delaware’s dams, dikes, and levees by the turn of the century. As these structures protect wildlife areas, people, property, and even contaminated sites, the resulting flooding would affect large areas and certainly the water quality of the riverine habitats themselves.
Non-tidal stream and river habitats in Delaware range from small headwaters and creeks to medium rivers. DNREC has found that 94% of Delaware’s rivers and streams do not fully support the fish and wildlife designated use as defined by criteria such as dissolved oxygen. Most of these waters do not meet the standards because of nonpoint source pollution impacts (DNREC 2013).
The Delaware Ecological Network (DEN) spatial analysis identified “core” streams that included at least 1 km of stream reach with the following characteristics:
DEN core streams totaled 2276 km, 26% of all streams, rivers, and ditches in the state (as measured by National Hydrography Dataset (NHD) flowlines, which missed most farm ditches and many small tidal creeks). The majority (74%) of core streams were tidal (Weber 2013).
Most current problems stem from non-point source pollution such as nutrients from agricultural fields and septic systems; hydrocarbon pollutants from streets and parking lots; and sediment from land that has been cleared for development. The hydrology of many streams has also been impacted by the increase in impervious surfaces that accompanies residential and commercial development, such that base flows have decreased, and storm flows have increased. Recent surveys of fish and mussel communities in non-tidal streams provide further indication of the condition of these habitats – species abundance was skewed toward types that are more tolerant of degraded habitat. Although water quality issues are being actively addressed, the rate of land development in Delaware will make long term improvements in stream habitat condition difficult to obtain.
Estuarine and Marine aquatic habitat classification in this plan generally follows the CMECS (FGDC 2012), which provides a comprehensive national framework for organizing information about coasts and oceans and their living systems. This system was developed by NOAA’s National Ocean Service, NOAA’s National Marine Fisheries Service, NatureServe, U.S. Environmental Protection Agency, U.S. Geological Survey, University of Rhode Island, and other partners.
CMECS classifies the environment into biogeographic and aquatic settings that are differentiated by features influencing the distribution of organisms, and by salinity, tidal zone, and proximity to the coast. Within these systems are four underlying components that describe different aspects of the seascape. These components provide a structured way to organize information and a standard terminology. The components can be mapped independently or combined as needed.
The Northwest Atlantic Marine Ecoregional Assessment (NAMERA) (Greene et al. 2010) was developed by TNC to classify marine aquatic environments from Cape Hatteras to the Gulf of Maine. Weaver et al. (2013) developed a crosswalk from the NAMERA aquatic habitat classification developed by TNC to the CMECS system.
Delaware falls within the NAMERA Mid-Atlantic Bight Ecoregion and the CMECS Virginian Ecoregion. The National Marine Fisheries Service (NMFS) developed a habitat assessment improvement plan to assist in gathering better data on marine fish habitats (NMFS 2010).
The condition of marine and estuarine habitats is poorly studied, due to lack of historical baseline data and limited funding, constraints identified in the NOAA NMFS Marine Fisheries Habitat Assessment Improvement Plan (NMFS 2010). Improvements in standardization of coast-wide habitat classification and survey methods (including CMECS) will allow improved assessment of the condition of these habitats.
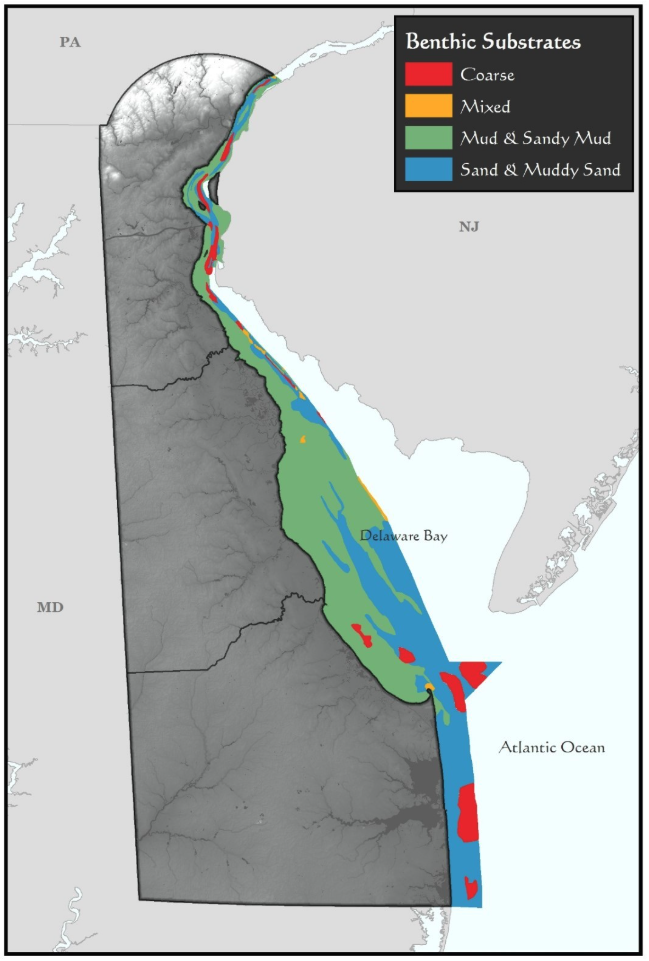
The Delaware Bay covers nearly one quarter the surface area of the state of Delaware. The Bay’s benthic habitats are highly diverse in their physical characteristics. They include shallow submerged mudflats, rippled sand flats, rocky hard-bottom habitats, silty and sandy shoals, shellfish beds, and tube worm reefs.
Generally, nearshore habitat in the Delaware Estuary has experienced an improvement since the 1930s and 1940s when pollution blocks degraded habitat, particularly in the upper estuary.
Sediment grain size in the Delaware Estuary varies across a wide range, from gravel to clay. The grain size of sediments is an important ecological indicator and one of the primary factors influencing the distribution of various benthic organisms and ecological communities.
In 2014, DNREC’s Delaware Coastal Programs completed work on an acoustic mapping project of the benthic sediments in the Delaware portion of the Bay and the nearshore Atlantic marine areas. This project classified substrates into one of four categories: Sand and Muddy Sand, Mud and Sandy Mud, Coarse Sediments, and Mixed Sediments (Delaware Coastal Programs 2014).
There is significant heterogeneity of sediment types and patchy distribution at many locations within the estuary, particularly in the reach from Wilmington to Liston Point. In this segment of the estuary, the dominant bottom sediment type is mud, whereas downstream of Liston Point the bottom is dominated by mixtures of sand and gravel with lesser amounts of mud. The zone of dominant muddy bottom corresponds to the estuary turbidity maximum (ETM), which results from the complex interaction of freshwater inflows from upstream sources with denser, more saline water from the Atlantic Ocean (Partnership for the Delaware Estuary 2012).
As part of TNC’s NAMERA, a detailed map of benthic habitat types was created for the Delaware Bay and Atlantic Ocean. These habitat types, called Ecological Marine Units (EMUs), are the three-way combination of physical variables: depth, sediment grain size, and seabed forms. The breaks in bathymetry and substrate grain size are based on ecological thresholds revealed by the benthic organism relationships.
The substrate types used in this plan are adapted from those used by the Atlantic Coastal Fish Habitat Partnership (ACFHP); these also correspond to the CMECS Substrate Component.
Related Topics: action plan, conservation, draft, fish and wildlife, habitat, plan, species, wildlife
Delaware's Governor
State Agencies
Elected Officials
General Assembly
Delaware Courts
State Employees
Cities & Towns
Delaware State Code
State Regulations
Business First Steps
Phone Directory
Locations Directory
Public Meetings
Voting & Elections
Transparency
Health Insurance
Tax Center
Personal Income Tax
Privacy Policy
Weather & Travel
Contact Us
Corporations
Franchise Tax
Gross Receipts Tax
Withholding Tax
Delaware Topics
Help Center
Mobile Apps
E-mail / Text Alerts
Social Media

Built by the Government Information Center
©MMXXVI Delaware.gov