

DNREC Menu
Delaware’s Wetlands Status and Trends reports are based on the results of wetland trends analyses by DNREC’s Wetland Monitoring and Assessment Program. Three reports have been published, one in 2001, a second in 2011 and a third in 2021.
Within the next five years, DNREC will produce updated Statewide Wetland Mapping Project (SWMP) maps which will incorporate any advances in mapping technology and refinement that has occurred since previous maps were produced in 2017.
Wetland mapping using the 2017 imagery identified 296,351 acres of wetlands across Delaware. Delaware is a small state, which enables wetland managers to conduct wetland inventory statewide, using landscape-level mapping with techniques that have improved over time.
The Status and Trends from 2007-2017 report:
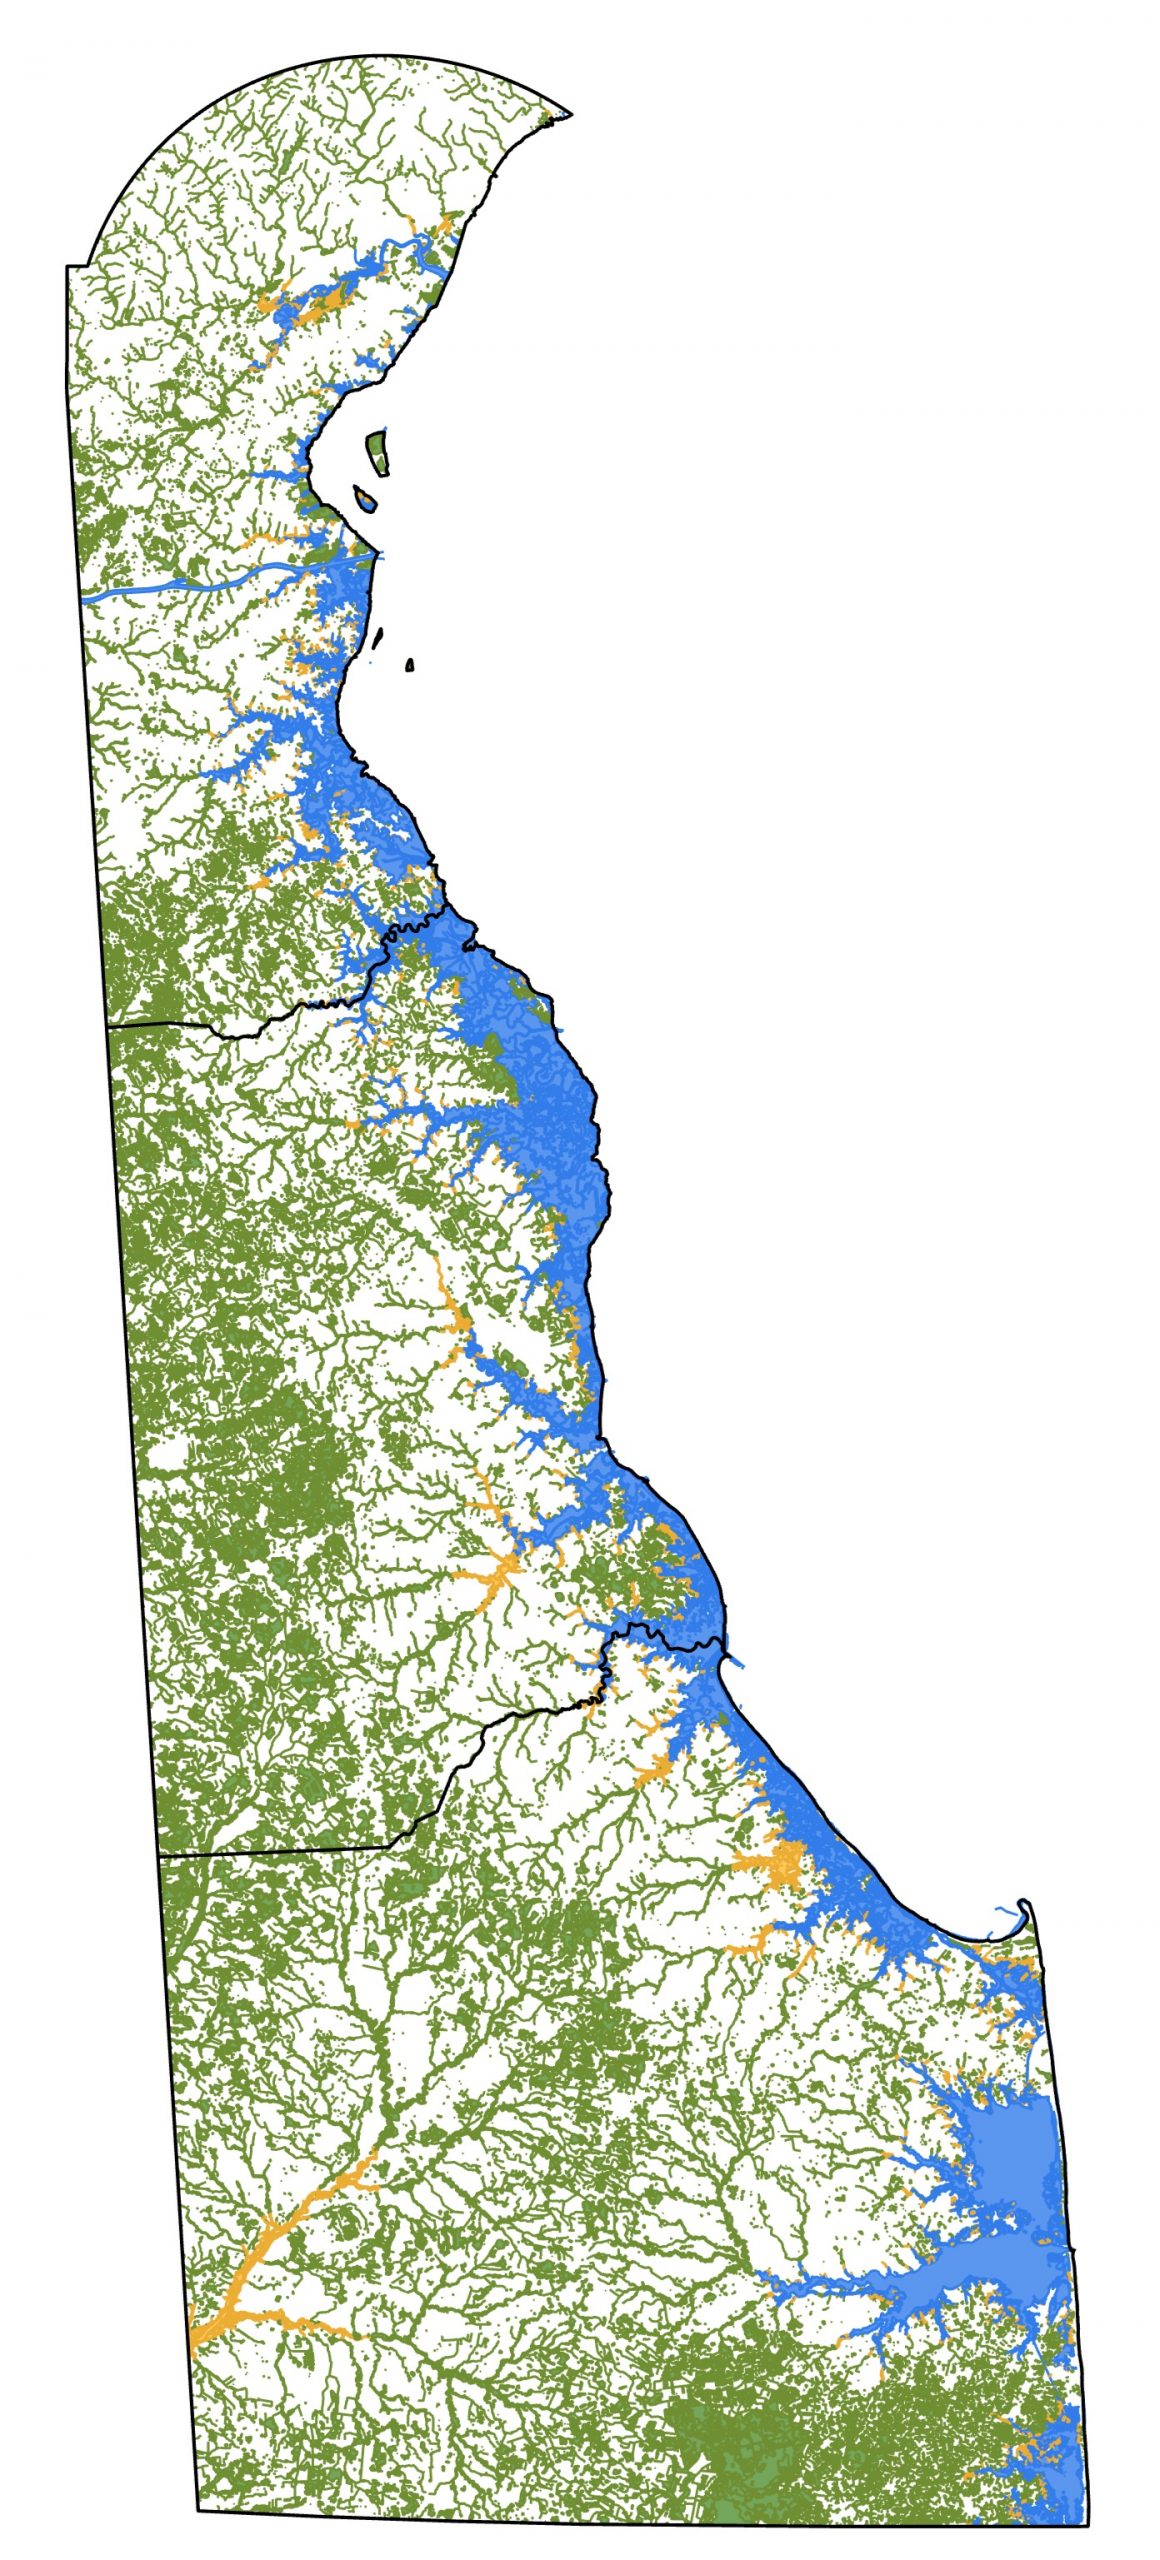
Based on the 2017 study, nearly 25% of Delaware was covered by wetlands. Non-tidal wetlands (freshwater), shown in green on the map, represented about 56% of the state’s wetlands, while tidal wetlands, shown in blue and orange comprised 44%.
Delaware has already lost approximately half of its wetlands since early human settlement. Natural causes of loss are currently increasing for coastal wetlands due to sea-level rise and erosion.
Delaware’s freshwater wetlands continue to see the most impact, largely caused by land clearing and development. With reduced jurisdiction incorporated at the federal level, there is increased need for a state freshwater program to protect wetlands.
Gains in Delaware’s wetlands were few and far between. While acreage increases were documented from 2007 to 2017, most wetland gains were the result of the installation of non-vegetated wetlands, such as stormwater ponds. Non-vegetated wetlands are not natural and do not perform certain functions, such as water absorption, at the same level as vegetated wetlands.
To maintain wetland acreage and beneficial functionality in the future, more gains need to occur as vegetated, or natural, wetlands.
The table below shows key findings from the three studies, comparing the number of acres of vegetated wetlands lost due to conversion to other land use, the acres gained in natural and man-made wetlands and the net loss of acres of vegetated wetlands for each time period studied.
| Comparative Highlights | 1981/82 – 1992 | 1992 – 2007 | 2007 – 2017 |
|---|---|---|---|
| Wetlands lost | 1,966 | 3,896 | 3,012 |
| Wetlands gained | 91 | 768 | 375 |
| Net wetlands loss | 1,905 | 3.126 | 2,636 |
The primary causes of vegetated wetland losses in the decade before 1992 were, first, conversion to agriculture and, second, residential development.
Between 1992 and 2007, the leading causes of wetland losses were the same, though residential development was the leading cause.
In the decade following 2007, land clearing and development were the leading causes of the loss of non-tidal. Environmental impacts were the leading cause of losses of tidal wetlands.
In all three studies, forested wetlands were the most vulnerable to losses.
Wetland acreage and ecological health are threatened by many stressors. They can be chemical, physical or biological. Wetlands that remain can be impacted directly and indirectly by stressors from some of the following categories:
Recent U.S. Supreme Court decisions have drastically scaled back the scope of the federal Clean Water Act. These decisions have reduced environmental regulations, weakened safeguards, impacted the permitting process and threatened fragile habitats.
All these factors produce direct and indirect impacts to wetlands such as increased flooding, degraded water quality and unsustainable development.
Despite improved public-sector collaboration, increased research and successful restoration efforts, Delaware’s wetlands faced many challenges during the 10-year period between 2007 and 2017. The best way to prevent future wetland losses and improve or maintain current wetland habitat is to target specific issues that were found to be most prevalent in each wetland type.
The 2007-2017 report outlines management recommendations for both tidal and non-tidal wetlands.
Tidal:
Non-tidal:
The previous two wetland studies were published in 2001 and 2011. The studies involved a comparison of aerial photographs from the early 1980s vs. the early 1990s and then again for 1992 vs. 2007. In both publications, wetland trends were identified as going to (loss) or coming from (gain) a specific land use or land cover type.
Delaware’s Wetlands: Status and Recent Trends (1981/2-1992)
Delaware’s Wetlands: Status and Changes (1992-2007)
U.S. Fish and Wildlife Wetlands Status and Trends Reports
Delaware's Governor
State Agencies
Elected Officials
General Assembly
Delaware Courts
State Employees
Cities & Towns
Delaware State Code
State Regulations
Business First Steps
Phone Directory
Locations Directory
Public Meetings
Voting & Elections
Transparency
Health Insurance
Tax Center
Personal Income Tax
Privacy Policy
Weather & Travel
Contact Us
Corporations
Franchise Tax
Gross Receipts Tax
Withholding Tax
Delaware Topics
Help Center
Mobile Apps
E-mail / Text Alerts
Social Media

Built by the Government Information Center
©MMXXVI Delaware.gov