

DNREC Menu
Delaware is experiencing high levels of particulate air pollution. The risk of health effects is increased for everyone. Consider limiting or avoiding activities outdoors.
Delaware está experimentando niveles elevados de contaminación atmosférica por partículas. El riesgo de efectos adversos para la salud es mayor para todas las personas. Considere limitar o evitar las actividades al aire libre.
Delaware ap fè fas ak gwo nivo polisyon nan lè a ki soti nan patikil. Risk pou sante moun afekte a ogmante pou tout moun. Konsidere limite oswa evite aktivite deyò.
More Info
Outdoor Delaware is the award-winning online magazine of the Delaware Department of Natural Resources and Environmental Control. Articles and multimedia content are produced by the DNREC Office of Communications.
Helpful information regarding air quality for your area is available online thanks to a tool from the Delaware Department of Natural Resources and Environmental Control.

Accessible at de.gov/airdata, the resource provides a quick and easy way to check what’s in the air, which can indicate how conditions outside may impact your health.
Updated hourly, the tool tracks ozone, particulate matter like dust and other very tiny droplets (both fine particles of 2.5 microns in diameter and coarse ones 10 microns in size), carbon monoxide, nitrogen dioxide and sulfur dioxide. An eight-hour average is also available for ozone.
Breathing in large quantities of any of these pollutants can result in short- and long-term health effects, especially for vulnerable individuals.
Overseen by DNREC’s Division of Air Quality, the tool presents details about air quality in a map format that utilizes a geographic information system to allow users to better understand where the air quality measurements are taken and what they mean.
It provides data from the 11 monitoring stations around the state making up the Delaware Ambient Air Monitoring Network, which enables DNREC to make information on air quality available in almost real-time to Delawareans and others.
Launched in 2024, the website is intended to be more user-friendly than a prior tool. In many ways, it’s very similar to the U.S. Environmental Protection Agency’s AirNow website, which provides maps showing air quality for ozone and particulate matter. However, DNREC’s tool goes more in-depth by offering information on several other pollutants as well.
“Community members and visitors may use the data to help them decide whether to do certain activities in that day,” said Tristan Bostock, a program manager with the Division of Air Quality.

The monitoring stations use sophisticated instruments to provide hourly measurements. Professionals from the Division of Air Quality conduct maintenance and quality assurance activities on a regular basis to maintain equipment functionality and data quality standards set by EPA.
While 11 stations (seven in New Castle County, two in Kent County and two in Sussex County) may not seem like a lot, it’s more than enough to closely track the First State’s air quality.
The sites are selected based on what pollutants they will measure, population density, EPA requirements like distance from roadways and other factors such as security and zoning. Most of the stations measure levels of one or two pollutants, but the monitoring station in Wilmington monitors each category of pollutant.
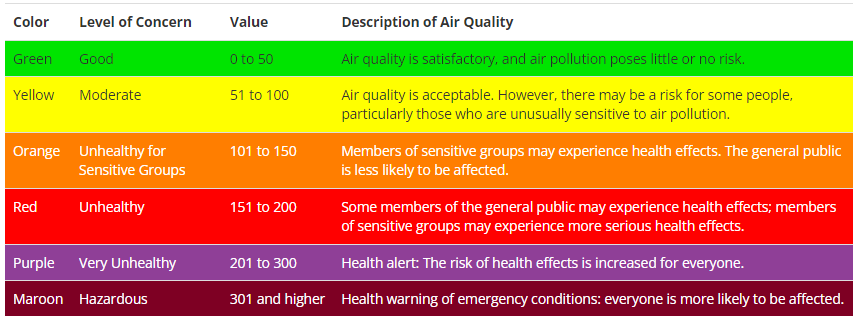
The tool displays the air quality data using EPA’s Air Quality Index, or AQI, which helps users to understand the air quality. The index, which is based on the federal National Ambient Air Quality Standards, or NAAQS, uses a number and color scale to quickly convey to the public the condition of the air. The tool shows preliminary data that have not been validated through quality assurance tests needed before they can be used for regulatory purposes. They are useful in showing what is happening at the moment with Delaware’s air quality.
The AQI uses a formula to adapt the NAAQS to a scale of whole numbers starting at zero and continuing past 300. A value of up to 50 indicates the air quality is good (green), 51 to 100 means it’s moderate (yellow), 101 to 150 informs individuals the air is unhealthy for sensitive groups (orange), 151 to 200 is classified as unhealthy (red), 201 to 300 is very unhealthy (purple) and above 300 is, while extremely rare, hazardous (maroon).
One hundred represents the national standard, with values in the double or single digits being seen as satisfactory.
Fine particulate matter of 4 micrograms per cubic meter, as measured at a Wilmington monitoring station at 1 p.m. on Oct. 3, translates to an Air Quality Index value of 17 — well below the level at which concerns may develop.
The index has been adjusted over the years to reflect updates to the health-based NAAQS: An ozone level of 80 parts per billion was considered moderate in 1999 but, today, above 70 parts per billion of ozone is viewed as unhealthy for sensitive groups.
A red value means people are urged to reduce long or intense activities and overall to limit outdoor activities. If the index reaches purple or maroon, individuals should minimize the time they spend outside.
When the index is orange, people are encouraged to make decisions that are protective of their health. This includes keeping medication, like asthma inhalers, on-hand and being proactive about going inside if they do not feel well. For those classified as sensitive, such as children, older adults and folks with asthma, this is only heightened.
Yellow is fine for most people, but those who are especially sensitive may choose (after consulting with their doctor) to take precautions.
At DNREC’s 11 monitoring sites, the highest pollutant value is used for the index, meaning if a site tracks sulfur dioxide and particulate matter and one is fine while the other is unhealthy for sensitive groups, the location will be categorized as orange.
One might be wondering why exactly they should care about these pollutants. After all, breathing is automatic, and people have been taking in the air in Delaware for a long time.
But, while some of us may take it for granted, clean air is a necessity. The pollutants EPA requires states to monitor can cause temporary breathing difficulty, long-term lung damage, respiratory illness, heart problems and more. Fine particulate matter, for instance, is much smaller than the width of a human hair and can make its way into the bloodstream.

For the Division of Air Quality, knowing the air quality, not only for an individual day but over the long term, is helpful for tracking trends and using the data to influence policy, including proposing new regulations. To cite one example, industrial facilities are prohibited from running tests on emergency generators when ozone levels are forecast to be above the standard (orange or higher on the AQI).
2023 was a perfect illustration of why access to prompt air quality data is valuable. During June of that year, wildfires burning an area much larger than Delaware raged across Canada, creating smoke that drifted south to plague our state and much of the Eastern United States. Residue and smog hung in the air, decreasing visibility, causing coughing and exacerbating health conditionsfor some.
All three counties were at least red on June 7, 8 and 29, and several other days saw orange, red or even purple classifications in a county or counties. During these events, air quality varied throughout the day, but access to the information allow people to understand what was happening and take precautions as needed.
For context, in 2020, 2021 and 2022 combined, there were a total of six orange days (five for ozone and one for particulate matter), and no days that were higher on the AQI scale.
Clearly, the 2023 wildfires represented extraordinary events. But, thanks to resources like the Division of Air Quality’s mapping tool, people can be prepared. And when a Code Red Alert was issued in June 2025 due to smoke from a New Jersey fire, people could turn to DNREC to gauge how they should respond.
Related Topics: air, air quality, air quality monitoring, aqi, health, outdoor delaware, science
Delaware's Governor
State Agencies
Elected Officials
General Assembly
Delaware Courts
State Employees
Cities & Towns
Delaware State Code
State Regulations
Business First Steps
Phone Directory
Locations Directory
Public Meetings
Voting & Elections
Transparency
Health Insurance
Tax Center
Personal Income Tax
Privacy Policy
Weather & Travel
Contact Us
Corporations
Franchise Tax
Gross Receipts Tax
Withholding Tax
Delaware Topics
Help Center
Mobile Apps
E-mail / Text Alerts
Social Media

Built by the Government Information Center
©MMXXVI Delaware.gov